
November 10th - Some interesting statistics and findings

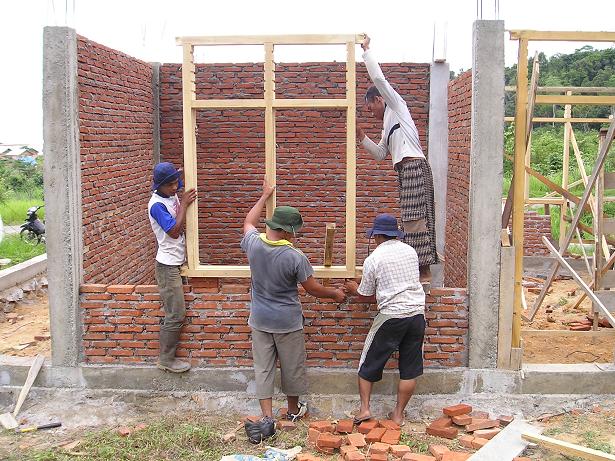
This week I left the relative comfort of Banda Aceh and returned to our field office in Calang and, as usual, it is always nice to be back in the field!

I have been spending my time here monitoring a number of projects, assessing training needs for staff and Community Development Board (CDB) members, collecting ideas for cross-visits, identifying best practices for mobilising and involving all community social groups and, finally, I have been working on the layout for a report which will be marking the two anniversary of the Tsunami.
Unfortunately, I am a little pressed for time this weekend so I am not going to be writing much in this week’s post. But here’s what I am thinking of writing about next time… Last week I wrote a little something about corruption and this led to a number of interesting discussions. One of the things that came up was the issue of whether or not CDB members should be paid for their work. This is a question that is frequently put to us by both CDB members and, on occasion, by CDR staff and I think it would be nice topic to explore.

For now, however, you are going to have to make do with a small sample of bullet point statistics and interesting findings that came out of our database. This will help you get an overview of who we are working with, or rather for, and the types of projects the communities are implementing. Bear in mind that the information about the CDB (member) profile and the priority needs and community projects is somewhat outdated. Information is missing for three communities where, at the time this data was analysed, the Community Participatory Assessment Workshop (CPAW) was in full progress and the CDBs were yet to be formed. But this is unlikely to have a great impact on the data presented below.
CDR Community Profile:
- The total population of the 42 communities we work in is 15,642;
- The average population size of the CDR communities is 372, with an average of 128 households per community;
- Three quarters of the communities we work in are not only tsunami affected but also conflict affected.
CDB (Member) Profile:
- On average there are 8 CDB members in a CDB;
- One third of the CDB members are women;
- The greatest number of CDB members fall in the age category of 30 to 34 years old;
- All CDB positions (e.g. coordinator, secretary, treasurer, logistics, other specific functions and simple member), with the exception of the role of treasurer, are dominated by men.
Priority Needs and Community Projects:
- A total of 426 priorities were ranked in 39 communities;
- 163 of these priorities are currently being addressed by the communities through the CDR programme;
- The communities contribute an average of 18.1 percent of the total project costs;
- The most frequently mentioned community priorities relate to social/cultural matters (26.8 percent), environmental health (19.7 percent), roads and/or bridges (11.7 percent), agriculture and/or fisheries (11.3 percent) and economic issues (10.3 percent);
Social/cultural priorities includes various types of centres (e.g. community centre, women’s centre, youth centre), sporting facilities and/or equipment, traditional ceremonial equipment and ‘other’ whereas the environmental health category includes water and sanitation (e.g. drainage, latrines, safe drinking water) and environment (e.g. environment cleaning, reforestation, sea and river defence)
- The majority of community projects address social/cultural issues (40.1 percent) or deal with roads and/or bridges (19.1 percent), environmental health (12.7 percent), agriculture (11.5 percent) and economic issues (7.6 percent);
- Close to two thirds of the projects are infrastructure projects;
- The higher the priority rank, the greater the proportion of priorities have been included as community projects – in other words, the emphasis clearly lies on tackling the most pressing community needs;
- Two thirds of the community projects target all community members alike while a significant percentage is aimed specifically at women (15.8) and children and/or youth (15.2);
- The community problem rankings have been consulted by a total of 52 other government or non-government organisations in 29 of the 39 communities. This has contributed to the identification and current implementation of an additional 58 projects in 26 communities, each of which is targeting a listed community priority.
See you week!
Take care,
Alex

posted by Alex Voets | 19:44
![]()
0 Comments:
Post a Comment
<< Home